This page contains infographics illustrating key statistics about Newham, sources are listed below.
For more detailed data and links please refer to the Newham facts and figures page.
Sources:
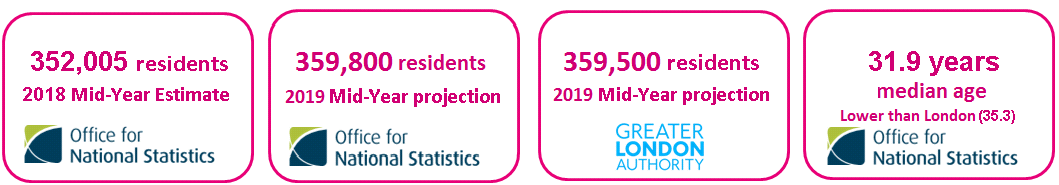
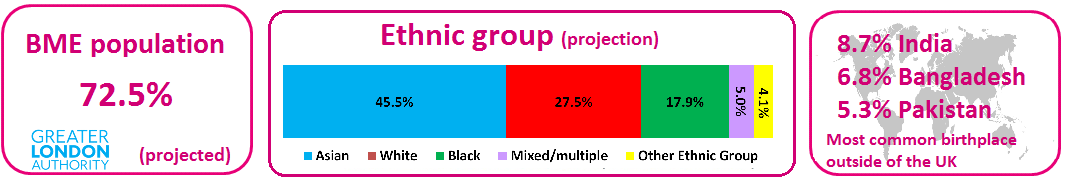
1.Office for National Statistics (ONS) 2017 Mid-Year Estimate (MYE), 2. ONS sub-national population projection (SNPP) 2016 based. Projection for mid-year 2019 3. The Greater London Authority (GLA) Housing-led projection variant from the 2016-based set of demographic projections. Mid-year 2019 projection. We are expecting an updated projection in the near future, this may mean that the projected 2019 figure will change. 4. from the ONS 2017 MYE.
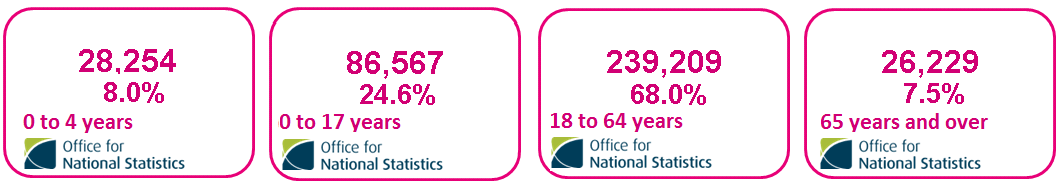
5, 6, 7 &8 – Office for National Statistics (ONS) 2017 Mid-Year Estimate (MYE). 2018 MYE is due to be published June 2019.
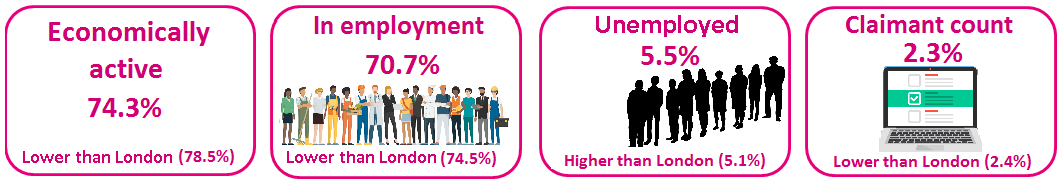
9,10,11 &12 – NOMIS website Newham Labour Market Profile
Most labour supply data in the Labour Market Profile comes from the Annual Population Survey (APS). The APS is the largest regular household survey in the United Kingdom. It includes data from the Labour Force Survey (LFS), plus further sample boosts in England, Wales and Scotland. Data period for 9,10 and 11 is October 2017-September 2018. 12. claimant count for December 2018.
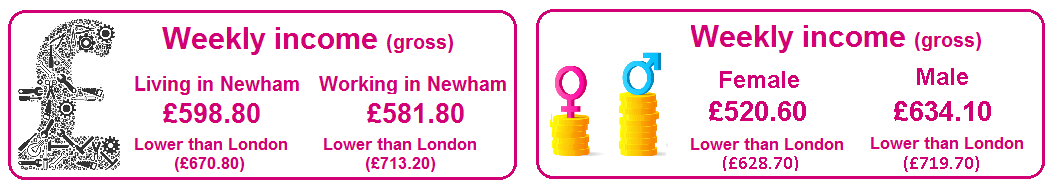
13&14– from the ONS Annual Survey of Hours and Earnings (ASHE) provisional 2018. All figures are based weekly gross income for full-time workers, the median income figure has been used. Table 8.1a was used for living in Newham and living in London figures. Table 7.1a was used for working in Newham and working in London figures.
15 & 16 GLA ethnic group projections housing-led variant, from the 2016-based set of demographic projections. Figure based on 2019 Mid-year projection. BME was calculated using all ethnic groups apart from those included in White. 17. ONS 2011 Census Commissioned table CT0048 data extracted using GLA Country of birth tool.
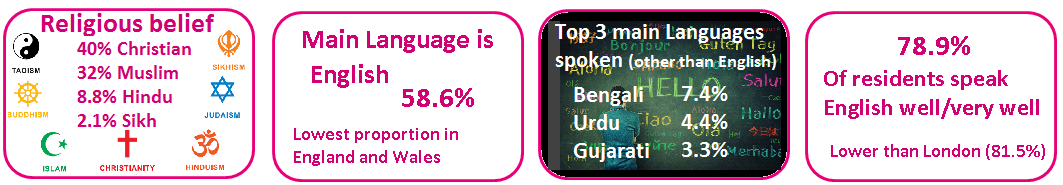
18. ONS 2011 UK Census table QS210EW. 19 & 20. ONS 2011 UK Census, table QS204EW. 21. ONS 2011 UK Census, table QS205EW . This figure is for those residents whose main language is not English. Language tables only include usual residents age 3 year and above.
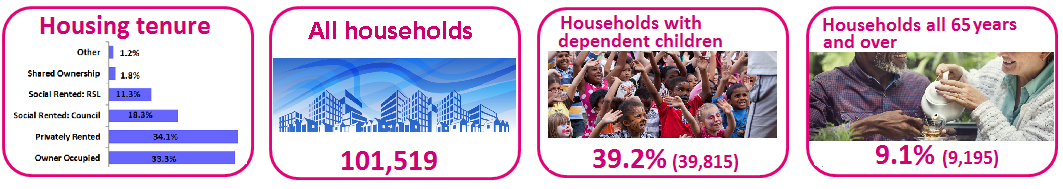
22. ONS 2011 UK Census table KS402EW. 23, 24&25 ONS 2011 Census table KS105EW.
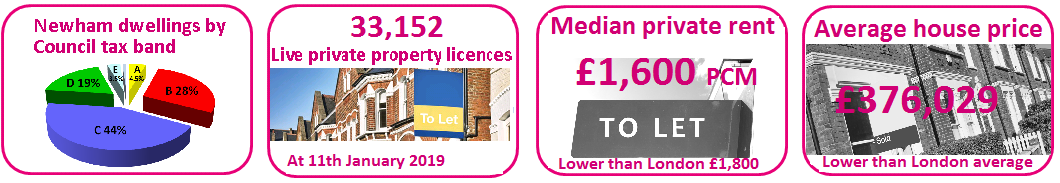
26. Valuation Office Agency: Council Tax statistics. At 31st March 2018 27. Statistics supplied by Newham Council correct at 11th January 2019. 28. Valuation Office Agency: Private rental market summary The figure is based on the ‘Three Bedrooms’ monthly rents recorded between 1 October 2017 to 30 September 2018 by administrative area for England. This is the median recorded for Newham. 29. UK House Price Index November 2018 based on an average terraced house.
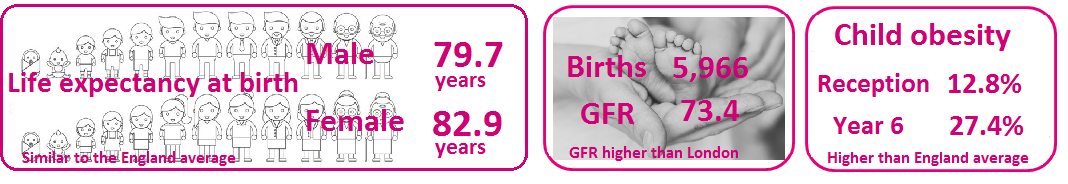
30.The Office for National Statistics Life expectancies figures calculated using data for 2015-17. Life Expectancy at birth is the average number of years a person would be expected to live based on contemporary mortality rates. 31. ONS births in England and Wales 2017 extracted using the NOMIS website. General Fertility Rate (GFR): all live births per 1,000 women aged 15 to 44, rates were calculated using the ONS 2017 Mid-Year Estimate. 32. Public Health England (PHE) Fingertips data based on 2017/18.
If you have any questions about these statistics please e-mail Newham.Info@newham.gov.uk
For more detailed data and links please refer to the Newham facts and figures page.